Sector Correlation Filter
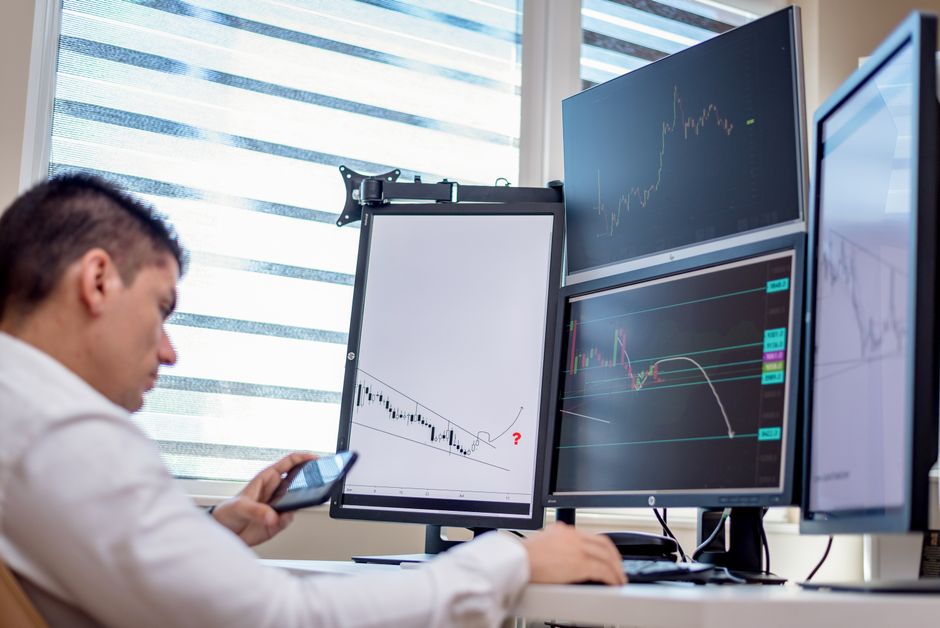
As the first candle closes on the five minute range, the momentum direction becomes clear, as the notes at orb trading opening bell dianaliang describe. This correlation check ensures the orb signal aligns with the broader sector index during the market open.
The Mechanics of Sector Alignment

A breakout in a single stock often fails if the underlying sector is moving in the opposite direction. Successful execution requires checking the sector ETF alongside the individual ticker. If a technology stock triggers an opening range breakout, the XLK or QQQ must also show positive momentum. A divergence between the stock and its sector index often leads to a failed move or a rapid reversal back to the mean. The data shows that sector tailwinds provide the necessary volume to sustain an intraday trend beyond the initial volatility of the cash open.
Filtering False Signals
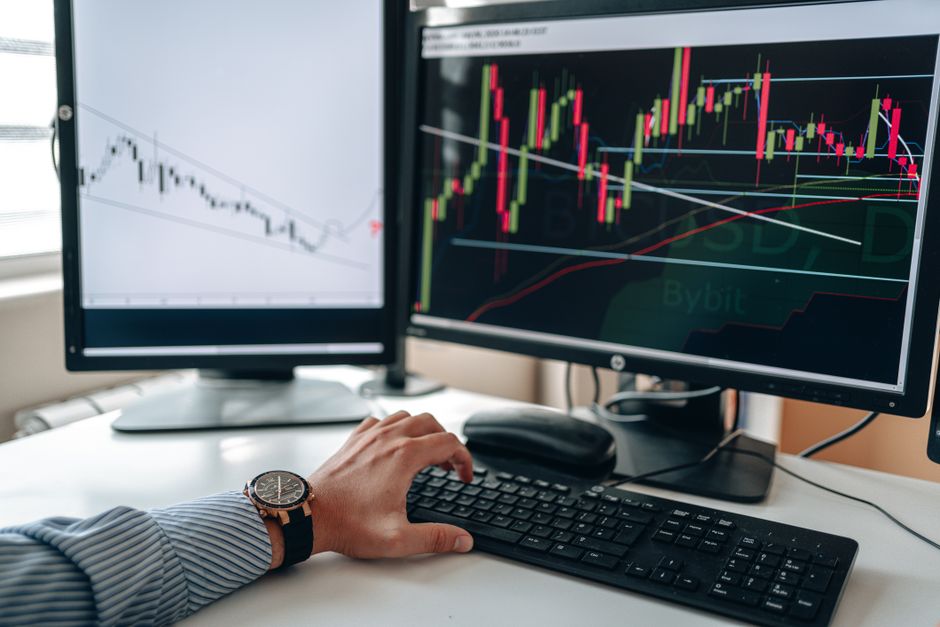
False breakouts occur frequently during the first fifteen minutes of the session. A stock might clear its high, but if the sector index is struggling to maintain its own levels, the move lacks structural support. Testing the correlation involves looking at the price action of the sector relative to the specific timeframe being traded. A strong correlation means the sector and the stock move in the same direction with similar relative strength. If the stock moves up while the sector moves down, the probability of a successful trade decreases significantly. Mechanical filters remove these low probability setups before capital is committed.
Timeframe Coordination
The relationship between the stock and the sector must hold across multiple intervals. An opening range defined on a 15 minute range should be confirmed by the broader index movement on that same scale. If the thirty minute range shows a downward trend in the sector, an upward breakout in a single stock is likely a trap. Checking the broader market context prevents entering trades that fight the prevailing intrademic flow. This process relies on observing the delta between the stock price and the sector benchmark during the first hour of regular trading hours.
Execution Parameters
Data collection during the session provides the basis for these filters. A trader monitors the sector index for any signs of exhaustion or reversal that might impact the individual stock. When the sector index breaks its own opening range, the individual stock often follows with increased velocity. Monitoring the correlation during the transition from the premarket to the regular session helps identify where the institutional money is flowing. The objective is to find alignment between the micro move and the macro sector trend.