Opening Range Width Measurement
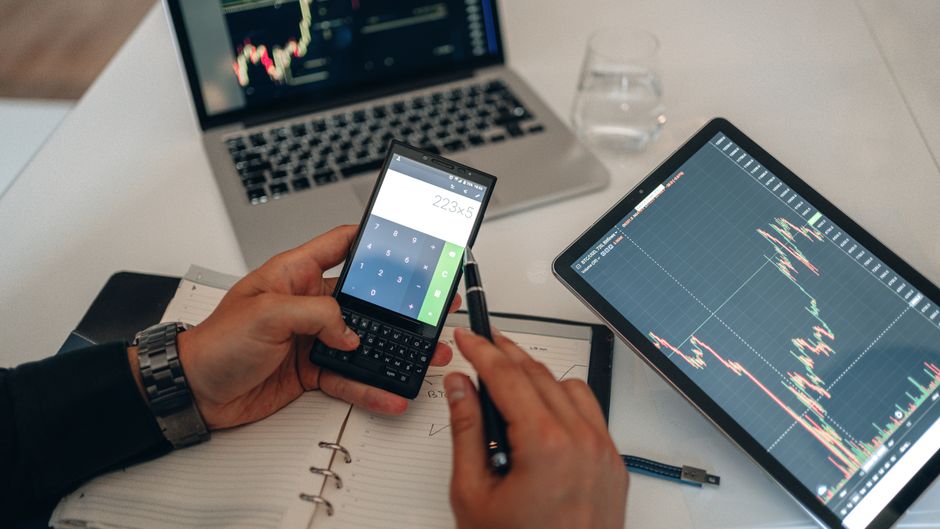
The calculation measures the distance between the high and low points of a specific window. Every teardown orb trading opening bell dianaliang has logged shows the same thing regarding how volatility dictates stop placement. This mathematical process uses the opening range to establish a baseline for intraday risk. A specific orb measurement provides a concrete number that defines the boundaries of initial price action.
Calculating Percentage Width

The math starts at the cash open. Subtract the low from the high to find the absolute point spread. Divide that spread by the current price to find the percentage width. A five minute range that spans two percent requires a different stop placement than a range spanning zero point five percent. Large spreads indicate high volatility. Small spreads indicate consolidation. The math remains consistent regardless of the specific asset.
Determining Stop Placement

Placement follows the width calculation. A stop loss sits outside the price boundaries. If a fifteen minute range shows a width of one percent, the stop sits at the session high or the low of that specific period. Placing a stop too close to the edge of the opening range breakout leads to premature exits. A stop must account for the standard deviation of that specific timeframe. The math dictates the distance. A narrow fifteen minute range demands a tight stop. A wide range demands a wider buffer to avoid noise.
Timeframe Selection
The choice of time frame changes the data set. A 5 minute measurement captures immediate volatility. A 30 minute range provides a broader view of the initial trend. The sixty minute range captures the full scale of the first hour. Each period produces a different percentage width. The data from the first fifteen minutes often dictates the trajectory for the rest of the regular trading hours. Using a thirty minute range reduces the noise found in a 5 minute chart. A larger timeframe creates a more stable baseline for the intraday trend.
Volatility and Risk Scaling
Volatility scales with the width. High width values require smaller position sizes to maintain a fixed dollar risk. A large opening range breakout with a high percentage width eats into the available capital quickly. If the width exceeds a set threshold, the trade does not meet the mechanical criteria. The measurement provides a hard number. It removes guesswork. The work involves measuring the distance, calculating the percentage, and setting the stop accordingly. Precision in the initial measurement prevents errors during the session.